Reports help you to get an overview of your entire business.
To view report click on Reports & Select the report you want to view.
Some Reports come filter relevant options to help you analyze your business better.
This report shows the total purchase, Purchase Including tax, Purchases with Dues amount; and Total Sale, Sale Including tax, Sale Due.
Shows the Input & Output Taxes.
This report shows the details of Purchase & Sell with all contacts (Suppliers & Customers) and also any Due amount. Positive Due amount indicates payment by contact, negative indicates payments to the contact.
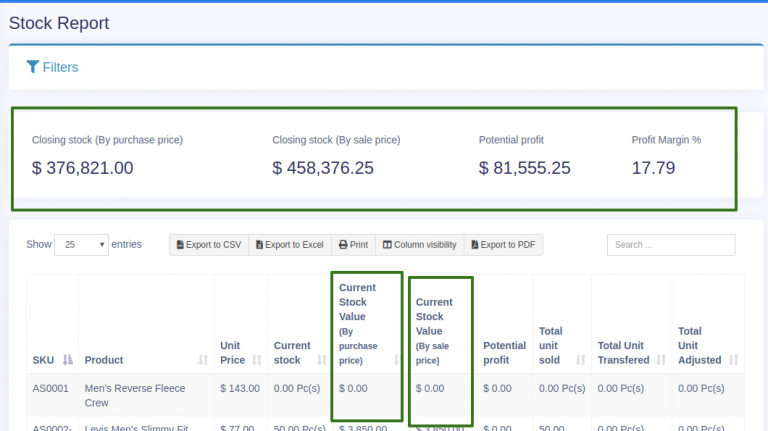
The stock report displays the stock details. With this, you can track the remaining stock and total sold quantity sold for all products.
For variable products -you can click on the Green Plus button before the SKU column to get details stock reports for each product variations.
In the stock report, you can also get information about the current stock value based on their purchase price & value based on selling price. Check the below screenshot of stock report.
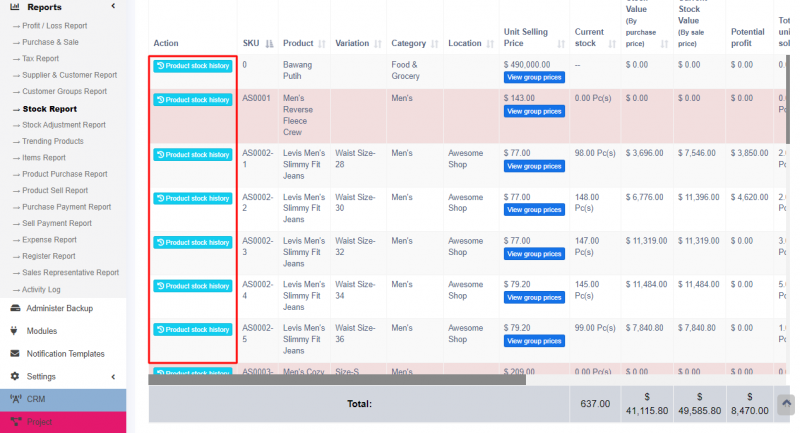
To check the product stock report datewise, use the ‘product stock history‘ link in the stock report.
Expense report helps you to analyze expenses for business locations and also analyze based on expenses categories.
View details of all registers and filter registers based on User and/or Status (Open or Closed)
Invoices are grouped based on certain criteria in the product sell report for the user’s convenience.
Go to Reports > Product Sell Report and click the Grouped tab.
The criteria used for grouping invoices here are date and product name.
For example; All Butter Cookies sold today will be shown in one row, and Butter Cookies sold yesterday will be shown in another row. Similarly for each product the invoices are grouped based on date and product.

